As one could imagine in the financial markets, thousands of investment strategies exist, which all have some arguments for and against them. Bottom line is that they all attempt to have some sort of predicting power. By acquiring an asset you believe it to have some sort of return, whether it is economic, environmental or any other kind. In this case, we’ll look at one of the most well-known models, Capital Asset Pricing Model (CAPM). Even though it finds it origins in the early 1960s, it still is widely used due to its clear approach and allows for straightforward comparisons of investment alternatives, whether it be stocks, funds or portfolios.
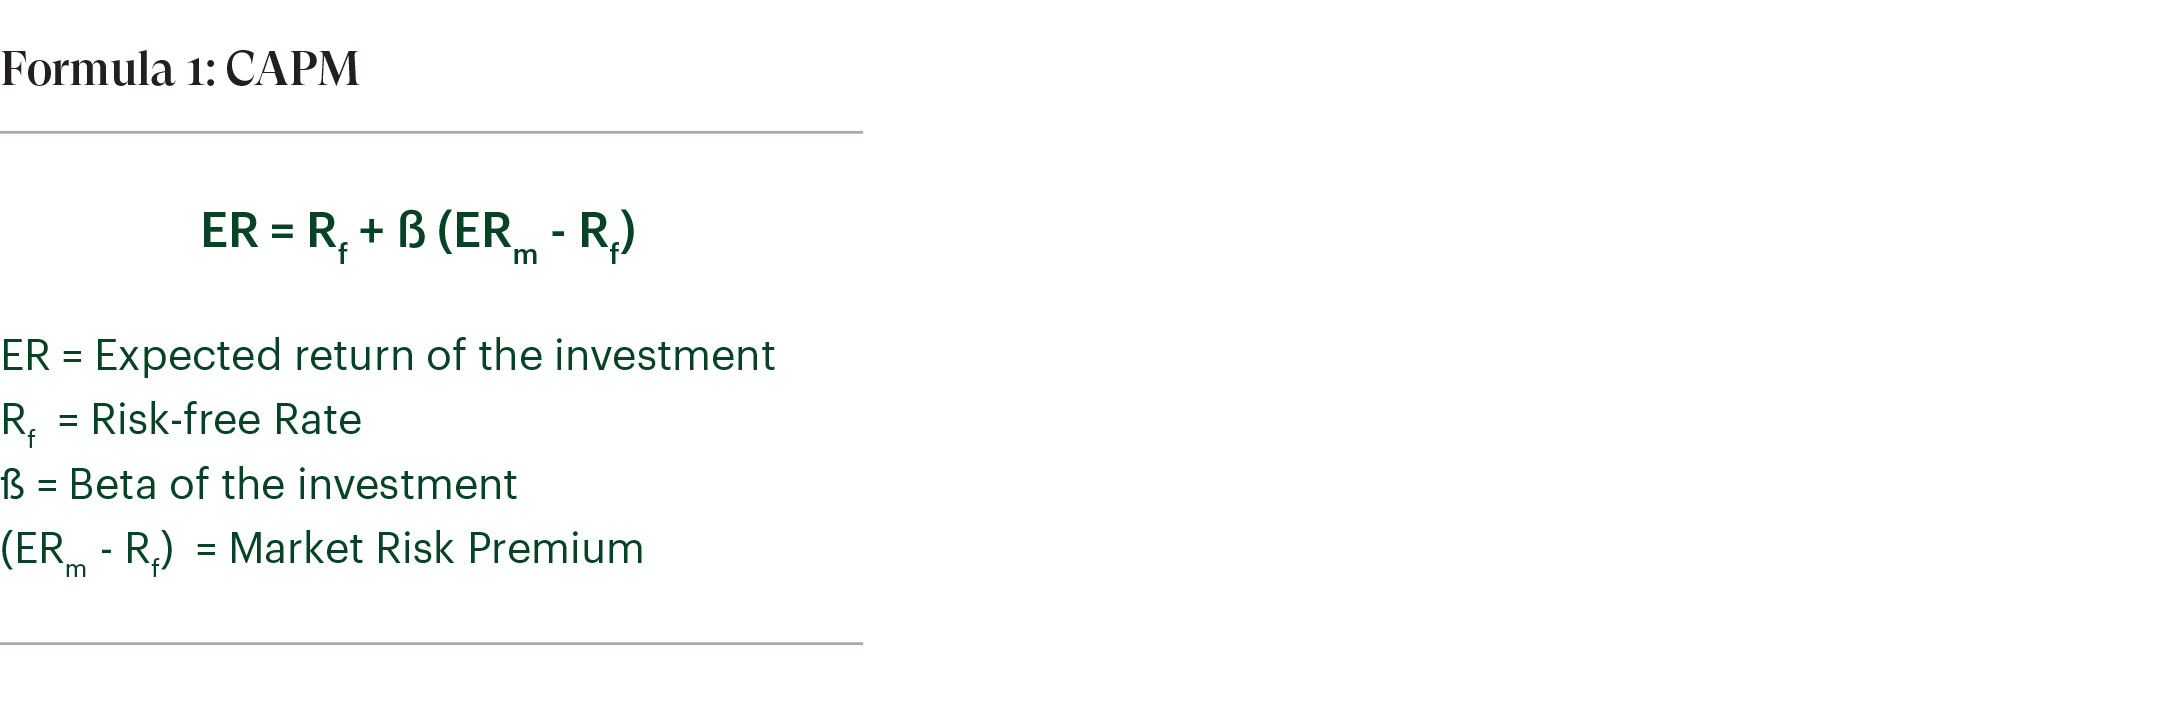
CAPM tries to captivate the Expected Return of an investor (ER), who wants to be rewarded for the time his capital is invested as well as for the risk he takes. CAPM accounts for both, the risk-free rate for the time value and the other part for risk. Formula 1 shows the different components, on which we’ll later elaborate.
General market parameters
If we leave any form of risk aside, the first thing an investor wants to be rewarded for is the time his capital is invested. So is there a more suitable name for the first variable that compensates for no risk and only time than the Risk-free Rate (Rf). As you must have heard from your private banker, in practice there is no such thing as a riskless investment, thus often used as an approximation, for this number, are the three-month US Treasury Bill for American investments and the German or Swiss short-term government bills for investments respectively in EUR and CHF. Reasoning here is that the market considers there to be virtually no chance of these governments to default on their (short-term) obligations.
Where the Risk-free return represents the minimum an investor expects, one should definitely want a premium for the additional risk an investment holds. This is where the Market Risk Premium or MRP (ERm – Rf) comes in, which in this case is computed by taking the Expected Market Return (ERm) and subtracting the risk-free rate. Just as the Rf this variable is derived from the general market and isn’t directly focused on the one security you’re analyzing. Again, in practice, there is no such thing as computing the average return of the entire market, which is why instead we should use a large pool of assets that relates to asset, referred to as the benchmark. For example, if we’re analyzing Microsoft, we could use a general index such as the S&P5001 as our benchmark, since it is regarded as one of the best gauges of prominent American equities’ performance. On the other hand, we could also go for an index that is more focused on the sector such as the S&P North American Technology Sector Index.
Interested in the full article? Download the article below.
Today the Capital Asset Pricing Model still serves well, mainly to compare investment alternatives in a straightforward manner.
